
http://scottpluschau.blogspot.com/
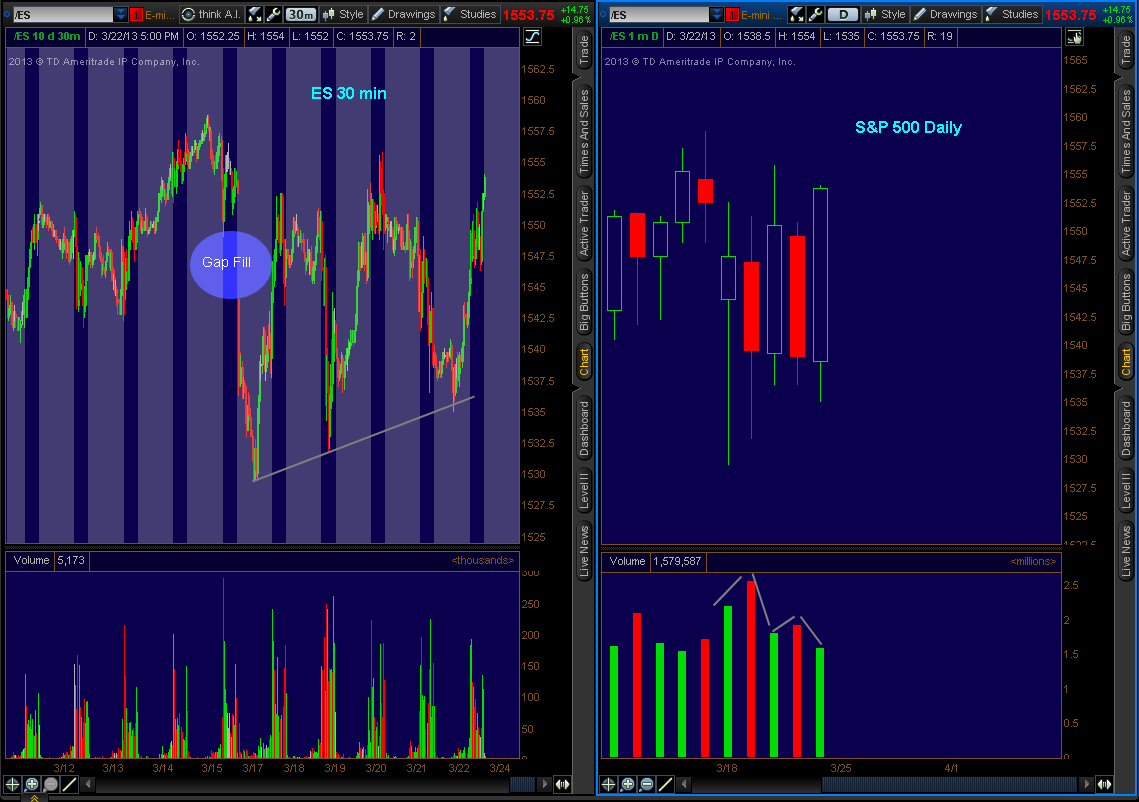
Last week's volume was the same theme we have been seeing and identifying for some time now. An increase in volume on Bearish price action and a decrease in volume on Bullish price action from the prior day. I have the Daily chart zoomed in and used grey trendlines on the volume sub graph to note this right hand side chart below.
Equities had a large gap down to start the week but filled the gap quickly which can be seen on the left hand side 30 minute chart clearly.
The playbook for sometime has been JBTD, "Just Buy the Dip", or better known in some parts as BTFD. How long does that last when the volume keeps declining on the rally? Sooner or later the playbook is going to be JSTR "Just Sell the Rally", or perhaps STFR.
(Click on chart to
expand)
Next weekend begins the April issue for the Swing/Position trade model portfolio as well as the Hard Asset model portfolio. Stay in tune with the ever changing price and volume patterns. Email for interest.
Twitter/ScottPluschau
Email: ScottPluschau@gmail.com
Source: http://scottpluschau.blogspot.com/2013/03/striking-pricevolume-divergence-last.html