Showing posts with label Technical Analysis. Show all posts
October 16, 2016
What's Going on With Mr. Market?
There is still no clear sign on the direction of the stock markets. But there is a lot more volatility these days, so it's advisable to stick with companies which are very stable, especially in the precious metals space.
Labels:
Dow Theory,
Economy,
Precious Metals,
Technical Analysis
July 17, 2016
Don't get on the bandwagon just yet
But don't get off it either!
The major US stock markets are making new all time highs, and it's tempting to jump in. But that pesky indicator, the transportation market, has been refusing to catch up.
IF a fire is lit under the transportation sector as a whole, we'll be in business for yet another bull run.
I wait with bated breath.
(that means I'm not selling or buying ... I'm holding)
June 5, 2013
NYSE Breadth unconfirming the rally again on Monday
By Scott Pluschau
Posted: 04 Jun 2013 06:38 AM PDT
The NYSE Advance Decline Line was lagging the price action and closed negative with after a big rally in the NYSE Composite Index on Monday afternoon.
You can see on the chart below, the right hand side is the AD line in the NYSE and its high of the day was at the open, and the close on the day was negative. Left hand side on the chart below is the NYSE Index and it was making new highs late in the day, and I believe it is the Algo type buy programs from speculators playing "squeeze the shorts", but the shorts that are building a position lately have been Commercial Traders with strong hands... I have been seeing this type of non-confirmation or bearish negative divergence in the market breadth/market internals for some time now. It is likely the US Equity market has another push on low volume toward new highs, but the next increasing volume selloff is going to be "check mate" for the "speculators" with the large leveraged position to unwind. (Click on chart to expand) Join me on Twitter/Stocktwits/Linked In @ ScottPluschau Comments are welcome ScottPluschau@gmail.com |
June 3, 2013
Regression to the mean
By Toby Connor
http://www.goldscents.blogspot.com
There’s a reason why commercial traders are regression to the mean traders. In this business it is the one thing that you can absolutely bank on. It's like death and taxes, it never fails. All markets eventually return to the mean. An appropriate corollary to this rule is that the further an asset gets stretched above or below the mean the more violent the regression is, and the further it will move past the mean during the snapback.
You can see this clearly in the chart below.
Notice that during the bull market from 2002 -2007 the S&P never stretched extremely far above the 200 day moving average (well until the final euphoria phase in 2007). Consequently each intermediate correction halted at or slightly below the 200 day moving average.
This changed when the new cyclical bull market started in 2009. It changed because the markets were not allowed to trade naturally. They were warped by massive doses of quantitative easing. This caused markets to stretch much further above the 200 day moving average than would have occurred normally. The consequences of course were that when the corrections hit they unwound violently and moved much further below the 200 DMA than would have occurred naturally.
This bull market is much more volatile than the previous one because the market is being driven by currency debasement instead of true economic expansion.
Now we are in a situation where the stock market has been stretched ridiculously far above the mean by QE 3 & 4. Trust me; Bernanke has not abolished the forces of regression to the mean. All he has done is guarantee that the regression is going to be many multiples more violent than it should have been.
When this house of cards topples over, I think there is a pretty good chance it’s going to be even more severe than what happened in 2011.
Also notice the red arrows marking major cyclical bull and bear market turning points. Notice the Fed warped the last cyclical bull market much higher and longer in duration than should have occurred naturally (he turned a 4 year cycle into a 6 1/2 year cycle). Consequently the forces of regression responded by triggering the second worst bear market in history. The current cyclical bull market, although not stretched as long in time, is extremely stretched in magnitude so the resulting bear market will almost certainly be exceptionally violent and protracted.
Mean regression rule: Without fail liquidity eventually finds its way into undervalued assets. An appropriate corollary to that rule would be that liquidity will eventually find its way out of overvalued assets.
Unless Bernanke has found a way to break the natural law of regression to the mean (he hasn't) then at some point we are going to see liquidity flee the overvalued stock market. When it does it's going to look for undervalued assets to land on. Nothing is more undervalued in my opinion than commodities in general and precious metals in particular.
Regression to the mean doesn't just apply to assets stretched to the upside. It also acts to levitate extremely depressed assets, and the same rules apply. The further an asset is stretched below the mean the more violently the regression usually is once the selling exhausts. Considering that gold is now stretched about as far below the 200 day moving average as it was in 2008 the rally, when it arrives, should be every bit as powerful if not more so than we saw in 2009.
In my opinion we now have the setup to drive either another C-wave as large or larger than the one out of the 2008 bottom, or this is the set up to drive the bubble phase of the bull market.
May 30, 2013
Stock Bubble: Wait for it to Pop
by Toby connor
www.goldscents.blogspot.com
I'm going to start off today and show you what Fed policy has given us over the last decade and a half. What the Fed has accomplished has been one bubble after another.
We are obviously in the final euphoric parabolic phase of a third stock market bubble. When viewed with the benefit of the 200 day moving average as a mean regression line, it's glaringly obvious just how dangerous this market has become. As history has shown, anytime the market stretches too far above the mean the forces of gravity eventually collapse price back to and often considerably below the mean.
Yet despite thousands of years of evidence that parabolas are never sustainable, investors invariably get suckered into buying into these moves and get caught when they inevitably crash.
This I can say with 100% certainty, this parabolic move in stocks is going to crash, just like every other parabolic move in history.
The smart investor will wait patiently on the sidelines and once the crash occurs the low risk trade will be to go long as the Fed will attempt to reflate the market. This is a virtually guaranteed strategy to make money, although very few people will have the patience to wait for the trade to develop.
The vast majority of traders will ignore the extremely risky environment, because his emotions make him think that he is getting left behind. He will buy into the parabola assuming that it will continue indefinitely (Does this sound familiar to the tech bubble and real estate bubble?).
History however has shown that this is never the case, and buying any asset this stretched above the 200 day moving average always turns out to be a gamble as to whether or not you can exit ahead of the crash. If you miss time the exit, and most people do, you end up paying a heavy price for following the herd into a trade that you logically know is too risky.
Once the stock market parabola collapses then the Fed's endless money machine will generate another bubble in another asset class.
I strongly believe the next bubble will be in the precious metals market.
May 16, 2013
What is important to note in the Nasdaq 100 chart is right here
By Scott Pluschau
Posted: 28 Feb 2013 07:05 AM PST
The Nasdaq 100 rallied hard off after failing to breakdown trendline support on the Daily chart, see right hand side below. I was setting myself up to go "Jugular" below the Bearish "Inverted Ascending Triangle" with an "Igniter Move" in price and volume on a breakdown of the trendline, but the Bulls in the larger degree timeframe continue to earn and deserve respect.
Near term the Nasdaq 100 has been making a set of lower lows and lower highs, (Blue Ovals left hand side 30 min chart) and even with the huge rally yesterday, this does not change the near term trend yet. The long trade has low expectancy. These are key reference areas to work with going forward for day-traders and swing/position traders, and long term traders in my opinion. When I used to go ice climbing in Huntington Ravine on Mt. Washington the park rangers used to post the avalanche warnings each day. They went from low avalanche danger, to moderate, to considerable, to high, and to extreme avalanche danger. Climbing in "Low Avalanche Danger" has a low expectancy of an avalanche, however that does not mean you can't get caught up in one. Yesterday was the avalanche to the upside in NQ. After identifying the phase of development a market is trading in, and identifying patterns, I am looking for favorable trade locations in terms of probabilities, reward and risk, and when the avalanche warning is "Extreme Danger" for one side of the contract long or short, that side might still make it up the ravine in one piece. I wouldn't feel comfortable doing that consistently over time. It all comes down to whether or not a climber gets caught in any avalanche on the slopes that they have a beacon, avalanche safety gear, or perhaps step to the side in time, which in this business means always have good risk management, and money management/position sizing in order to escape unhurt and climb again. (Click on chart to expand) Stay in tune with the phases of development, and patterns of price and volume each trading day with the swing/position trade model portfolio service to begin tomorrow. Details here: http://scottpluschau.blogspot. This weekend begins the first issue in the "Hard Asset" Long Term Investing Model Portfolio, and those details can be found here: http://scottpluschau.blogspot. Email for interest ScottPluschau@gmail.com After this weekend the model portfolio services will be closed to new subscribers until at least April 1st. The last post on the Blog on the Nasdaq 100 is here: http://scottpluschau.blogspot. Twitter/ScottPluschau |
Labels:
Critical Reads,
Technical Analysis,
Technology
The most important futures chart in the World right now is the Nikkei 225
By Scott Pluschau
Posted: 16 May 2013 04:54 AM PDT
The Nikkei 225 is going on a parabolic move on the Daily chart in which the rally is so intense it appears to be going up now at a 90 degree angle.
It reminds me of the "Dot Com" days, and some of the charts I saw that imploded and/or cratered not much longer after this. One recent example is the chart in Silver back in 2011 when it was approaching $50 it was going at a nearly 90 degree angle. Left hand side on the chart below is the Silver Daily chart in 2010-2011; right hand side is the Current Nikkei 225. Pricing Patterns, Volume, Phase of Development, are similar because the underlying contract trades in an "auction". The theories/principles of Auction Market's apply to all futures contracts in all time frames. (Click on chart to expand) What is important here is the S&P 500 seems to be following the Nikkei 225's lead with relentless demand, demand I believe is rampant speculators with Algo's. But besides that fact there is relative weakness in just about every risk asset compared to the S&P 500. I believe the entire financial universe is at the mercy of the "risk off" environment when it comes in the S&P 500. I believe the S&P 500 is ripe for a 5-20% correction, for various reasons and what I feel are valid reasons. Will you be prepared or ready to find the "Diamonds in the Rough" at that time? Picking Tops is a deadly ego game, but if I was forced to pick one, and don't hold me to it, it is 1671 in the S&P 500 which is the "measured rule" of the most recent "bull flag" pattern on the 30 min chart. Notice on the left hand side where the first flag appeared, it coincided with the Breakout above 1600 on the Daily chart, right hand side chart. Flag patterns are continuation patterns. The first flag had its "measured rule" target fulfilled. The most recent flag puts the target at 1671 using measured rule, which is taking the distance from the top of the flag pole/mast to the bottom of the flag pole/mast and adding it onto the breakout point. Demand can shut off when the pattern is fullfilled as the losing side of the contract gets flushed out. In regards to flags and measured rule, the saying is the flag flies at half mast. I have seen three flags in a row before, so one more is certainly possible, but at that point I would say the term "over extended" or "over bought" would apply. (Click on chart to expand) Twitter/Stocktwits/Linked In @ ScottPluschau |
May 14, 2013
Another day with the Siren going off in the Nasdaq Composite Index
Monday, May 13, 2013
By Scott Pluschau
And the Siren I hear is of the "warning" kind.
Here is a look at the Nasdaq Composite Index Advancing Minus Declining Line in Issues for Monday May 13th, 2013. While the Nasdaq Composite Index was up on the day, making new 52 week Highs, this indicator was NEGATIVE 176 Issues at its high point of the day which can be seen in the white bubble high on the chart below.
(Click on charts to expand)
The next chart below of the Nasdaq 100 futures shows the volume has not been above the 50 period moving average since the breakout of trendline resistance on the Daily chart.
I believe for many reasons it is the rampant speculator pumping the market higher, such as those who write "Algo's" on the Major US Equity Index Futures. I do not believe it is the Long Term Investor who is involved, making these markets ripe for a 5-20% correction.
Twitter/Stocktwits/Linked In @ ScottPluschau
Contact ScottPluschau@gmail.com
May 9, 2013
Euphoria Phase Turns into the Parabolic Phase
By Toby Connor
www.goldscents.blogspot.com
The euphoria phase of the bull market that I warned about months ago is now beginning its final parabolic phase.
I'm guessing we still have another month to month and a half before this runaway move finally ends. Depending on how far above the 200 day moving average it ends up stretching, I think there's a pretty good chance we will see the entire intermediate rally wiped out in a matter of days or even hours when this house of cards finally comes tumbling down.
That is how these runaway moves terminate. They crash! Parabolas always crash.
These things can go on and on for months and months with savvy investors becoming more and more nervous the longer the move persists. The longer the trend continues the more professional traders all position right next to the exit, until finally one day everybody tries to get out the door at the same time. It's that mass exodus to lock in profits that triggers the crash. The magnitude is determined by how far and how long the market stretches above the 200 day moving average.
Markets are no different than a pendulum. They oscillate back-and-forth above and below the median line, which in this case is the 200 day moving average. Bernanke is not doing anyone any favors by stretching the market unnaturally far to the upside. All it is going to do is guarantee an exceptionally violent move to the downside once the forces of regression to the mean break the parabola.
Again, I would warn traders not to try and sell short as it's virtually impossible to determine when the parabola is going to fail. My best guess is late June or early July based upon the normal timing band for the dollar index to form its next intermediate degree bottom. As I expect the crash to correspond with a dollar rally that would seem to be as good a guess as any.
For savvy traders the play isn't to sell short, it's to go long once the crash has occurred as the Fed will almost certainly double down on QE in the attempt to reflate asset prices.
Of course the real play isn't going to be in the stock market. The stock market is in the topping phase of this cyclical bull market. Yes, the Fed may be able to levitate stocks back to marginal new highs, but the real money is going to be made in commodities as all that excess liquidity will inevitably make its way into the undervalued commodity markets where the potential return is many multiples greater than in a very mature cyclical bull market in stocks that includes a weakening global economy.
Source: http://goldscents.blogspot.ca/2013/05/euphoria-phase-turned-into-parabolic.html
May 5, 2013
The Dollar's Collapse Has Begun, and the Stock Market Keeps Stretching, Stretching, Stretching
By Toby Connor
I've been pointing out for several months now that the recent rally in the dollar was a mirage, an illusion generated by the yen, euro, pound, and Canadian dollar all dropping into yearly, or intermediate cycle lows together. This selling pressure in the four major currencies that make up the dollar index spawned what looked like a strong dollar.
With Bernanke printing 85 billion of them a month, there is no such thing as a "strong dollar". I've been saying for months that once these four currencies completed their bottoming cluster it would be the dollar's turn to crash. The recent collapse in the yen was 23%. The Pound 9%. I think the dollar will be somewhere in between with a loss of 9-12% as it drops down into its yearly cycle low.
As this process starts to accelerate over the next couple of months the dollar bulls are going to get a rude awakening, as our currency shows its true colors. The acceleration began today as the dollar has now completed a lower low and a lower high.
Once major support is breached at 78.50 there will be nothing to stop, what I think will be a waterfall decline, until the dollar reaches the 73-75 zone.
And don't forget this is just the beginning. The much larger degree, 3 year cycle low, isn't due until late next year.
It's time for the unintended consequences of QE infinity to come home to roost.
This should drive either another C-wave in gold. Or as I'm now starting to believe, gold may be in the initial stage of the bubble phase of the bull market. 2015 will be 15 years. That's about a normal during for a secular bull run.
Let's face it, common sense would tell most people that you can't just print 85 billion dollars a month and not have something bad happen. The last time the Fed embarked on this kind of insane policy it was during the real estate bubble implosion. Instead of rescuing the housing market the Fed drove oil to $150 a barrel and spiked food prices around the world, triggering riots and wars in many third world countries.
I expect the same game plan this time is going to reap the same results.
We have all the ingredients in place. Gold has probably completed its yearly cycle low. The COT is showing a max bullish position by commercial traders. Before every bubble phase there is always a devastating correction that convinces everyone that the bull is over. I would say that describes pretty much what has happened over the last 6 months.
And to top it all off the recent manipulation to run the stops below $1523 has triggered massive shortages in the physical market, especially in silver.
Now add to that a collapsing dollar over the next year and a half and everything is in place for gold to generate at the very least another C-wave advance and in my opinion we probably have the conditions necessary for the bubble phase to begin.
The runaway move in the stock market that we have been watching over the last few months continues to stretch higher and longer. Let me emphasize again, these things always end badly. Usually in some kind of crash, or semi crash.
I strongly advise traders not to chase this move. It's way too late and risk is extremely high. If you don't time the exit perfectly you risk getting caught in the crash.
The way to correctly trade a runaway move like this, is to wait patiently for the crash to unfold, and then buy long as the Fed doubles down on QE in the attempt to reflate asset prices.
The crash could happen at any time, but based on the intermediate dollar cycle, which is due to bottom in late June or early July, I'm expecting the stock market swoon to correspond with the dollar rallying out of that major bottom. So my best guess is in late June or early July we will see this artificial rally come crumbling down.
Let me emphasize that while I think the crash is going to occur later this summer, there is no guarantee it can't happen sooner.
On a side note: I heard a commercial yesterday in Las Vegas for a seminar on how to get rich flipping houses. Seriously? Are we really stupid enough to go down that road again?
April 30, 2013
Some signs of Bearish Divergence are intensifying in Equities
By Scott Pluschau
www.scottpluscua.blogspot.com
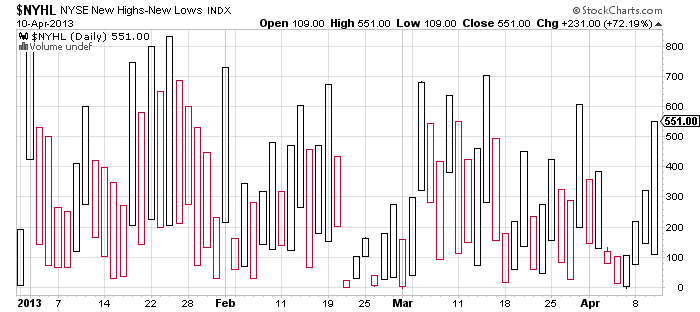
Posted: 30 Apr 2013 05:48 AM PDT
Yesterday the Nasdaq Composite Index made new 52 week highs, and here is a look at both the Composite Daily chart and the Breadth in the new 52 week highs minus new 52 week lows in that Index year to date.
COMP COMP NH-NL In the S&P 500, the Price/Volume Divergence continues. Notice the volume has been not only below average on the push to new 52 week highs but it is falling off a cliff with the Bullish Price action. S&P 500 Russell 2000 This is even more glaring in the Russell 2000, where the volume was as light as any non-holiday in the past 12 months. Lastly here is a look at the NYSE Daily Index chart showing new 52 week highs, and the NYSE new 52 week highs minus new 52 week lows. The NY NH-NL didn't even get above two day's ago net figure. NYSE NYSE NH-NL May 1st, begins the next issue for the swing/position trade model portfolio, and I look forward to sharing the trade plan in regards to any short opportunities in the major US Equity Indexes in the coming months with my trading methodology. Email for interest. ScottPluschau@gmail.com Tabs at the top of the blog have further information on the premium services. Twitter, Stocktwits, and Linked In @ Scott Pluschau |
April 16, 2013
Setting the Stage for the Bubble Phase?
By Toby Connor
Until recently I was expecting the bubble phase for gold to occur as we came out of the next 8 year cycle low in 2016.
However with the panic sell off over the last two days and break of support at $1523, I'm now starting to think what we are seeing is the washout prior to the bubble phase. The Nasdaq in 98, and oil in 2007 are perfect examples of the transition into the "bubble"
Notice how these very harsh corrections all tend to reverse violently from severe oversold conditions and then never look back.
I'm starting to think that's what is transpiring in gold right now. We are in the washout phase and once the bottom forms gold will launch straight into the bubble phase over the next year and a half/two years. That will necessitate a rethink on how the next 8 year cycle is going to play out. Instead of the eight year cycle low generating the bubble as originally expected, it will signal the end of the secular bull market.
This means the bubble phase may come earlier than I was expecting with a final top in late 2014 or early 2015 instead of 2017/18.
A top in 2015 would still be a 15 year secular bull market which is about normal for these things.
More in last night's report...
However with the panic sell off over the last two days and break of support at $1523, I'm now starting to think what we are seeing is the washout prior to the bubble phase. The Nasdaq in 98, and oil in 2007 are perfect examples of the transition into the "bubble"
Notice how these very harsh corrections all tend to reverse violently from severe oversold conditions and then never look back.
I'm starting to think that's what is transpiring in gold right now. We are in the washout phase and once the bottom forms gold will launch straight into the bubble phase over the next year and a half/two years. That will necessitate a rethink on how the next 8 year cycle is going to play out. Instead of the eight year cycle low generating the bubble as originally expected, it will signal the end of the secular bull market.
A top in 2015 would still be a 15 year secular bull market which is about normal for these things.
More in last night's report...
April 14, 2013
Waterfall Declines in Silver and Gold
The greatest chance for a waterfall decline is when a contract is riding a dowward sloping trendline in my experience. This didn't take place with the first break in support in Silver, but the next break at that swing low was a gusher. One thing that may have opened up the flood gates in Silver was the fact that it failed to follow through to the upside when the prior support level was initially taken back. That was a major failed opportunity for a change in trend.
(Click on charts to expand)
Silver
Gold
The "Hard Asset" Model Portfolio premium service has no positions in the Precious Metals and I am welcoming the carnage here for the opportunity to invest for the Long Term. Currently the Hard Assset Model Portfolio has 15% allocated, with 85% in cash. It is liquid and ready to take advantage of what I see are signs of the inevitable. Which will be bargains in Hard Assets, and the Producers of those Hard Assets with a US Equity market correction, or sustained Global "Risk Off" type environment.
The last trade to the long side in Gold in the "Swing/Position" trade model portfolio was exited at $1,666. The path of least resistance has been lower since then. The patterns in price and volume should not be ignored when trading in my strongest belief in regards to "Risk Management". There is nothing more important in this business than "Risk Management" and chart analysis plays the most critical role in that with my methodology.
Sign up for for a premium service in May by sending me an email. ScottPluschau@gmail.com.
Information can be found in the tabs at the top of the blog on the two model portfolios.
Previous metals posts on the blog that are worth the time to look back on are here:http://scottpluschau.blogspot.com/2013/04/gold-and-silver-patterns-had-measured.html
here:
http://scottpluschau.blogspot.com/2013/03/silver-is-coiling-for-big-move-platinum.html
and here: http://scottpluschau.blogspot.com/2013/03/precious-metals-morning-special-gold.html
Most blog posts are posted to my accounts at Linked In, Stocktwits, and Twitter @ ScottPluschau
Source: http://scottpluschau.blogspot.ca/2013/04/waterfall-declines-in-silver-and-gold.html
April 11, 2013
The remaining lines of Defense for the Bears in the Russell 2000, Nasdaq 100, and S&P 500
By Scott Pluschau
www.scottpluschau.blogspot.com
Yesterday the S&P 500 mini futures had bullish price action and increasing volume for a change. When it took back the extended backside of prior trendline support it was "Risk On". If you day trade, and you ignore the key reference areas of the chart, you do so at your own peril. I have highlighted this on the Hourly chart left hand side below.
(Click on chart to expand)
The right side chart above shows the S&P 500 is at the backside of trendline resistance on the Daily chart and one such scenario that is possible is a "blast off" busting through here.
I mentioned in the morning update to subscribers the most important contract to keep an eye on yesterday going into the trading session was the Russell 2000.
When it took back major overhead resistance, there are two things a trader can do, 1) go long, or 2) stay on the sideline. Trading short is not an option. There is minor resistance at the upper extreme of the Balance Area, but above there, the path of least resistance is higher.
Nasdaq 100 exploded through the extended trendline on the Hourly chart (see blue oval), and like the S&P it is at trendline resistance on the Daily. Notice the previously failed breakdown on the Daily at the major trendline and the reaction since.
One last chart to look at that is practically unbelievable is the NYSE NHNL indicator which measures the new 52 week highs minus the new 52 week lows, and it is still lagging or unconfirming the highs.
Here is the Nasdaq NHNL, which is also stunningly lagging and unconfirming.
There are key reference areas, and there are favorable trade locations in relation to the key reference areas to trade from. But most important is risk management.
The swing/position trade model portfolio has had one short in Equities in the past three months and it was in Emerging Markets, which was and is still showing relative weakness, however even that trade had to be exited (at a small profit).
Plenty of opportunities to short may still be coming, and they may be the greatest opportunities ever, but the bottom line is a trader can't fight the tape for long in this business.
Stocktwits and Twitter @ ScottPluschau
Email: ScottPluschau@gmail.com
Source: http://scottpluschau.blogspot.com/2013/04/the-few-lines-of-defense-for-bears-in.html
We Are Now getting Deep Into The Euphoria Phase
By Toby Connor
We are now at the point in the bull market where traders think that stocks are bullet proof.
Back in December I warned this was coming. I said at the time that this round of QE was going to be different. That it would have a much bigger effect on the market than the analysts were expecting. I remember at the time analysts were claiming each round of QE was having less and less effect.
I was confident that QE3 & 4 would usher in the euphoria phase of the bull market. Actually Bernanke is putting in place the final components to bring about the end of the bull. Let me explain.
QE infinity has, and is generating a runaway move in the stock market. The problem with a runaway move is that it's artificial. Let's face it anyone with a shred of common sense knows what's driving this move and it isn't the economy. Bernanke is crazy if he thinks the stock market is acting normal. Well this is the guy that said the subprime crisis was "contained". Any artificial move is destined to end badly, just like the artificial housing market ended badly.
The problem with runaway moves is that they stretch way too far above the mean in both price and time. As this process progresses institutional traders become more and more nervous, so the market becomes more and more shaky. Kind of like a heavy snowfield just waiting for that last snowflake to turn it into an avalanche.
And that's exactly how these runaway moves end. At some point all of these nervous investors try to get out the door at the same time, and you get a crash or semi crash. My best guess is that it will come in June or July. Until then the market will probably continue to creep higher with occasional 40-50 point corrections.
That's another characteristic of runaway moves. They set a standard correction size early in the move and all corrections there after fall in the range. Then at some point one of those corrections spikes through the range and months of gains get wiped out in a matter of days, or even minutes. The flash crash in 2010 is an excellent example of a runaway move crash.
So here's what I think is going to play out. Unknowingly Bernanke has put in motion a runaway move that will end in some kind of crash this summer. Depending on how long and far above the 200 day moving average this thing stretches will determine how violent the crash will be when the forces of regression take over. If this lasts till summer like I think it could then we could see a crash of 15-20%.
When that happens Bernanke is going to freakout and crank up the printing presses even faster. 85 billion may become 150 billion. When that happens commodity markets are going to go crazy just like they did in 07/08 as Bernanke tried to print away the real estate implosion.
When commodity prices spike, economies collapse...just like they did in 2008.
All the pieces are starting to fall into place. QE infinity is driving a runaway move in stocks that will end like all runaway moves, with some kind of crash scenario. That will trigger even more printing which will spike commodities next year, and that will be the end of the economy and the beginning of the end for this stretched and extended cyclical bull market. Look for a final top late this year or early in 2014 and a very extended topping process as the fundamentals slowly overwhelm Bernanke's printing press.
April 3, 2013
Gold and Silver patterns had "Measured Rule" fulfillment..
By Scott Pluschau
The "Measured Rule" target was reached in a fraction of the time it took to form the pattern.
Gold is finding support at the major trendline on the Daily chart. Sometimes the supply can shut off temporarily when the measured rule target is reached. There is still potential for the flood gates to open up again below major trendline support.
(Click on chart to expand)
Silver lost support of a "Coil" on its Daily chart (right hand side below) and the "Measured Rule" of this pattern was fulfilled as well.
Silver is sitting on major trendline support now, which is a downward sloping trendline and this resembles a "Slide". "Waterfall" like declines have the greatest probability when these types of trendlines break down with volume. Will the supply shut off after the Coil measured rule was fulfilled? Time will tell, but I am ready for any reaction beforehand.
These patterns were laid out to subscribers in the weekday morning updates to subscribers before these breakdowns in advance. Stay in tune with the ever developing and changing patterns in price and volume each morning with the premium service.
Risk management starts with knowing where there are increasing probabilities for an increase in supply and demand. One can always re-enter a trade when the market does not meet expectations. Email for more information on the premium services that are offered.
Twitter and Stocktwits @ ScottPluschau
Email: ScottPluschau@gmail.com
April 1, 2013
The recent concerning theme of Price/Volume continues in the Nasdaq 100
By Scott Pluschau
Diminishing Volume over the past five days of Bullish price action in the Nasdaq 100 futures which can be clearly seen on the one month Daily chart. There is a lack of excitement for higher prices in the US equity Indexes.
The price volume divergence in the US Equity Markets this year is quite bizarre.
(Click on chart to expand)
There is one position open in the Swing/Position trade model portfolio at this time, and the service is closed to new subscribers in April.
The Hard Asset portfolio has two open positions now, with an open order yet to fill. 7.5% of the capital has been invested and there is plenty in reserve.
Those interested in receiving the weekend update and joining the Hard Asset premium service for the next four weeks can still do so this week. After this weekend that service will be closed for the remainder of the month.
More information can be found here: http://scottpluschau.blogspot.
Stocktwits and Twitter @ ScottPluschau
Email: ScottPluschau@gmail.com
March 28, 2013
Sustainable and Unsustainable Trends
By Toby Connor
www.goldscents.blogspot.com
Today I’m going to start off with a look at the big picture. The next chart pretty much says it all.
There is a fundamental reason why gold has been going up for 13 years. That same fundamental is driving the cyclical bull markets in stocks. For gold the fundamentals are sustainable and that’s why the gold chart is rising almost parabolic inter-spaced with normal corrections/consolidations along the way. For stocks the fundamentals aren’t sustainable. You can’t drive a true bull market in stocks by printing money. It just creates bubbles and crashes. That’s why each one of these bull markets is followed by a devastating bear market. It’s why the stock market chart has gone nowhere in 13 years while gold has gone up, up and away.
Until the fundamentals change this pattern isn’t going to change. Pretty soon the stock market is going to stagnate and start to drift sideways (followed by another bear market, probably due to bottom in 2016). Pretty soon gold is going to generate another C-wave leg up (followed by another sharp move down into the next 8 year cycle low, also due in 2016).
Gold:Did we bottom two days ago or not? I don’t know. What I do believe is that the QE4 manipulation has basically created a double B-wave bottom. As we saw last summer, B-wave bottoms are frustrating SOB’s that whipsaw back and forth until everyone is knocked off, or dizzy and ready to puke. Then they take off and leave everyone behind.
I think gold is in the process of breaking the manipulation but as we have seen it’s been tough to get a sustainable trend going. That is the hallmark of a B-wave bottom. Ultimately I think the manipulation just stretched the precious metals markets much further to the downside than would have occurred naturally, so once gold breaks free of this volatile bottoming process the rally will be just as aggressive if not more so than the rally out of the first B-wave low last summer.
As we saw last summer, B-waves can churn to the point were it’s pretty difficult to determine correct cycle counts. It appears to be happening again. Considering the current daily cycle is left translated it should drop back below $1555 before bottoming. That being said today’s move looks like the cycle low may have come on Friday. I wouldn’t count on gold to give us a clear signal in this environment though. So it’s anyone’s guess if we now have a strange left translated daily cycle that bottomed above the prior low.For those of you trying to hold on to positions during this mess let me put up two more charts.
On the gold chart you can see the level that triggered a 99 and a 98 Blees rating on the COT report. Historically that kind of extreme only occurs when price is at, or very close to a final intermediate bottom.You can also see that this price level generated an 88 million buying on weakness day in GLD. Again this is almost always a sign that price is about as low as it’s going to go. Let me emphasize I said price, not time. Just because price has reached a level that halts the selling doesn’t necessarily mean that a sustained rally will start immediately. As we have seen the market may still have to chew up a significant amount of time before it’s ready to take off. In our case I think gold is waiting for the stock market to stagnate before hot money starts to flow back into the sector.So we may have one more lower low to endure before this is over, and we may not, but two years from now traders will be knocking their head against the wall saying “all the signs were there, why didn’t I buy?” Or; “Why didn’t I hold my Old Turkey position?”

This bottom is going to be too complex to time perfectly, and even if it did bottom on February 20th it’s already shown that it can still throw most people off just by chopping back and forth for a month. Maybe that chop has finally ended. Maybe the daily cycle is still going to make one more trip below $1600. I’ll let others compete to see who can second guess the next wiggle in the precious metal markets. All I can say is that the signs are there. Save your head the abuse two years from now and pay attention to them.
www.goldscents.blogspot.com
Today I’m going to start off with a look at the big picture. The next chart pretty much says it all.
There is a fundamental reason why gold has been going up for 13 years. That same fundamental is driving the cyclical bull markets in stocks. For gold the fundamentals are sustainable and that’s why the gold chart is rising almost parabolic inter-spaced with normal corrections/consolidations along the way. For stocks the fundamentals aren’t sustainable. You can’t drive a true bull market in stocks by printing money. It just creates bubbles and crashes. That’s why each one of these bull markets is followed by a devastating bear market. It’s why the stock market chart has gone nowhere in 13 years while gold has gone up, up and away.
Until the fundamentals change this pattern isn’t going to change. Pretty soon the stock market is going to stagnate and start to drift sideways (followed by another bear market, probably due to bottom in 2016). Pretty soon gold is going to generate another C-wave leg up (followed by another sharp move down into the next 8 year cycle low, also due in 2016).
Gold:Did we bottom two days ago or not? I don’t know. What I do believe is that the QE4 manipulation has basically created a double B-wave bottom. As we saw last summer, B-wave bottoms are frustrating SOB’s that whipsaw back and forth until everyone is knocked off, or dizzy and ready to puke. Then they take off and leave everyone behind.
I think gold is in the process of breaking the manipulation but as we have seen it’s been tough to get a sustainable trend going. That is the hallmark of a B-wave bottom. Ultimately I think the manipulation just stretched the precious metals markets much further to the downside than would have occurred naturally, so once gold breaks free of this volatile bottoming process the rally will be just as aggressive if not more so than the rally out of the first B-wave low last summer.
As we saw last summer, B-waves can churn to the point were it’s pretty difficult to determine correct cycle counts. It appears to be happening again. Considering the current daily cycle is left translated it should drop back below $1555 before bottoming. That being said today’s move looks like the cycle low may have come on Friday. I wouldn’t count on gold to give us a clear signal in this environment though. So it’s anyone’s guess if we now have a strange left translated daily cycle that bottomed above the prior low.For those of you trying to hold on to positions during this mess let me put up two more charts.
On the gold chart you can see the level that triggered a 99 and a 98 Blees rating on the COT report. Historically that kind of extreme only occurs when price is at, or very close to a final intermediate bottom.You can also see that this price level generated an 88 million buying on weakness day in GLD. Again this is almost always a sign that price is about as low as it’s going to go. Let me emphasize I said price, not time. Just because price has reached a level that halts the selling doesn’t necessarily mean that a sustained rally will start immediately. As we have seen the market may still have to chew up a significant amount of time before it’s ready to take off. In our case I think gold is waiting for the stock market to stagnate before hot money starts to flow back into the sector.So we may have one more lower low to endure before this is over, and we may not, but two years from now traders will be knocking their head against the wall saying “all the signs were there, why didn’t I buy?” Or; “Why didn’t I hold my Old Turkey position?”
This bottom is going to be too complex to time perfectly, and even if it did bottom on February 20th it’s already shown that it can still throw most people off just by chopping back and forth for a month. Maybe that chop has finally ended. Maybe the daily cycle is still going to make one more trip below $1600. I’ll let others compete to see who can second guess the next wiggle in the precious metal markets. All I can say is that the signs are there. Save your head the abuse two years from now and pay attention to them.
Subscribe to:
Posts (Atom)