Sunday, May 6, 2012
By Scott Pluschau
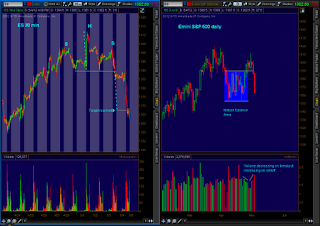
The daily time frame had a breakout recently from a mature "Balance Area" or "Rectangle" formation on unconvincing volume in the Emini S&P 500 futures. One profit taking "Throwback" is normal, but this prior level of resistance and now support got tested multiple times which weakens it. A "Head and Shoulders" pattern developed on a 30 minute chart and as the daily chart was breaking down inside the balance area it was the ideal trade setup. When a market moves back inside a balance area, it can move back across the length of the balance area in a fraction of the time it took to form it.
I went into some details of a head and shoulders pattern in this recent post here: http://scottpluschau.blogspot.com/2012/05/head-and-shoulders-on-russell-2000.html
The risk of this type of trade is above the right shoulder of the head and shoulders pattern, and the initial profit taking target is the "Measured Rule" which was nailed on a day with a significant increase in volume on the daily chart. In this situation a trailer can now be left on to target the horizontal support of the rectangle in the daily time frame which can enhance the "positive expectancy mean" to the overall trading system when compared to the initial risk taken.
Let's take a look at some changes in the legacy "Commitments of Traders Report" and "Open Interest" for the S&P 500 consolidated futures contract. The consolidated report combines the large pit traded contract and the Emini contract at 250X the index. Any analysis of futures market behavior on the weekly timeframe that doesn't take into consideration these changes is a grave mistake in my opinion. Going back to the middle of February this year the S&P 500 was trading about where it is now approximately. Assuming my math is correct in these calculations, a look at the February 21st, 2012 report shows the commercial traders NET long 11,821 contracts. This Friday's report shows the commercial traders NET short 31,292 contracts and open interest between these two reports has increased 8,512 contracts. This has been "Distribution" from the informed money.
Ignore the complete study of price, volume, auction profile, open interest, and the COT Reports at your own peril.
(Click on chart to expand)
I will be sending out an email to all the potential subscribers in the next couple of days with the latest updates. Thank you for your patience.
twitter/ScottPluschau
Consulting? ScottPluschau@gmail.com
Members to Scott's blog are appreciated

